animation of train delays
Hello & Welcome
photo of myself

Hi, I'm Bri. I'm currently working as a Data Analyst.

I'm a big fan of civic technology and doing work for public good. I recently graduated from University of Pennsylvania's Urban Spatial Analytics program, where I was doing that kind of work.

In my free time you can catch me warming up in the sun, inspecting plants indoors and outside, or diligently building my next dream house in the sims.

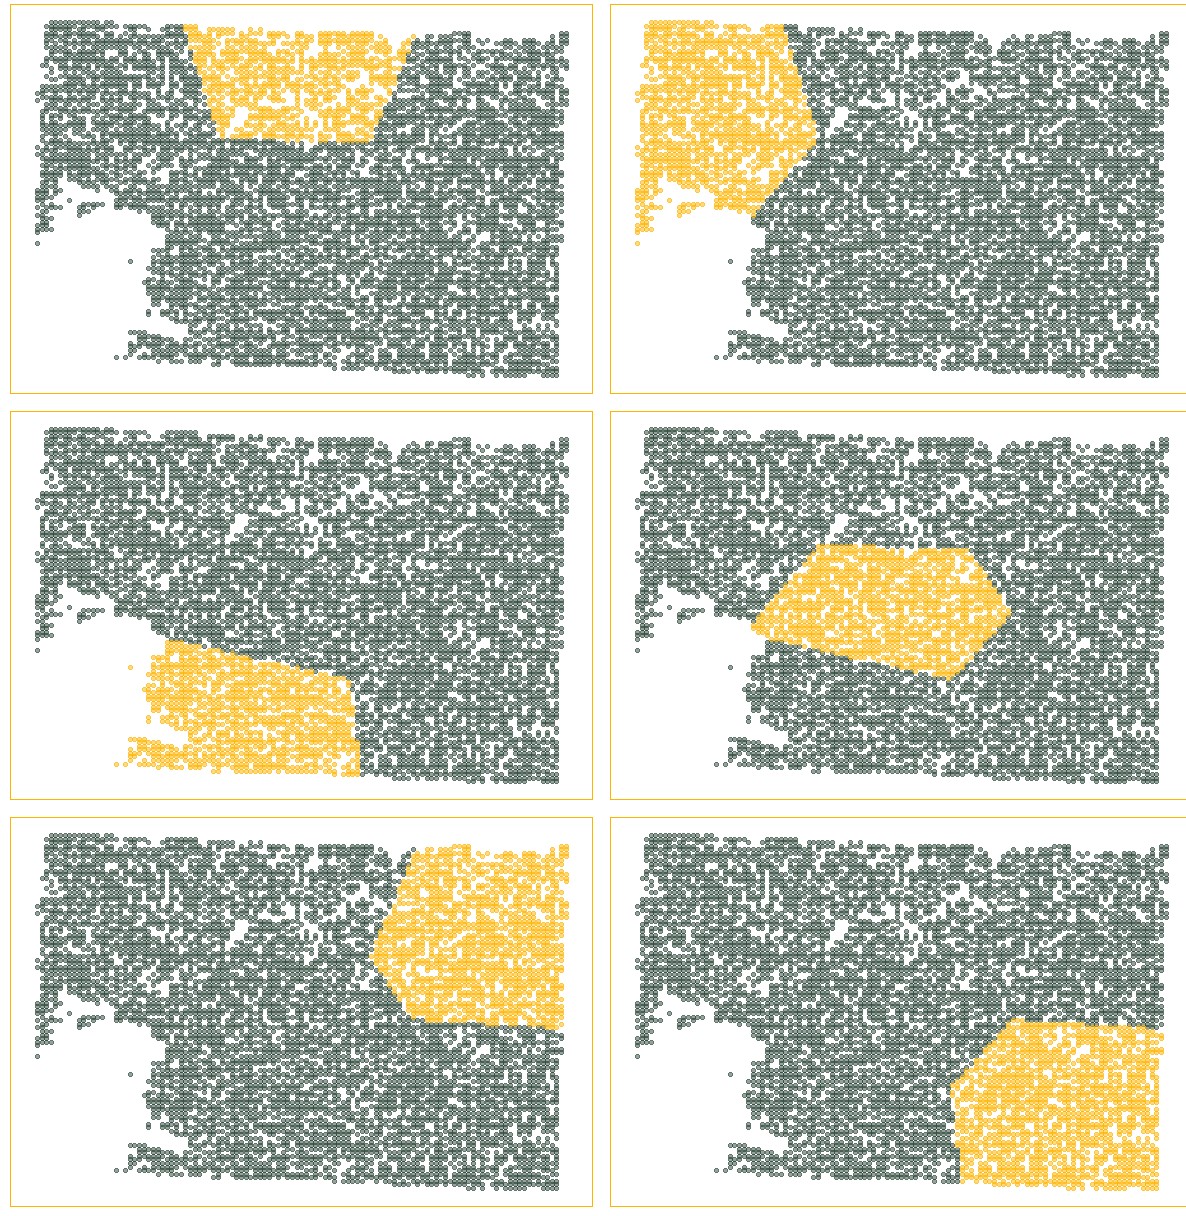
series of maps

Geospatial Structure Fire Risk Model

Read More

This project investigates the spatial pattern of structure fires and fire risk factors across Guilford County, North Carolina with the purpose of building a model to predict future fire risk. The model uses information from past fires and latent risk to inform predictions in order to equip Guilford County EMS with a deeper understanding of where there is exposure to risk of structure fires and which parts of the county exhibit greater vulnerability, so that they can make data-driven decisions around how to establish a common standard of cover.

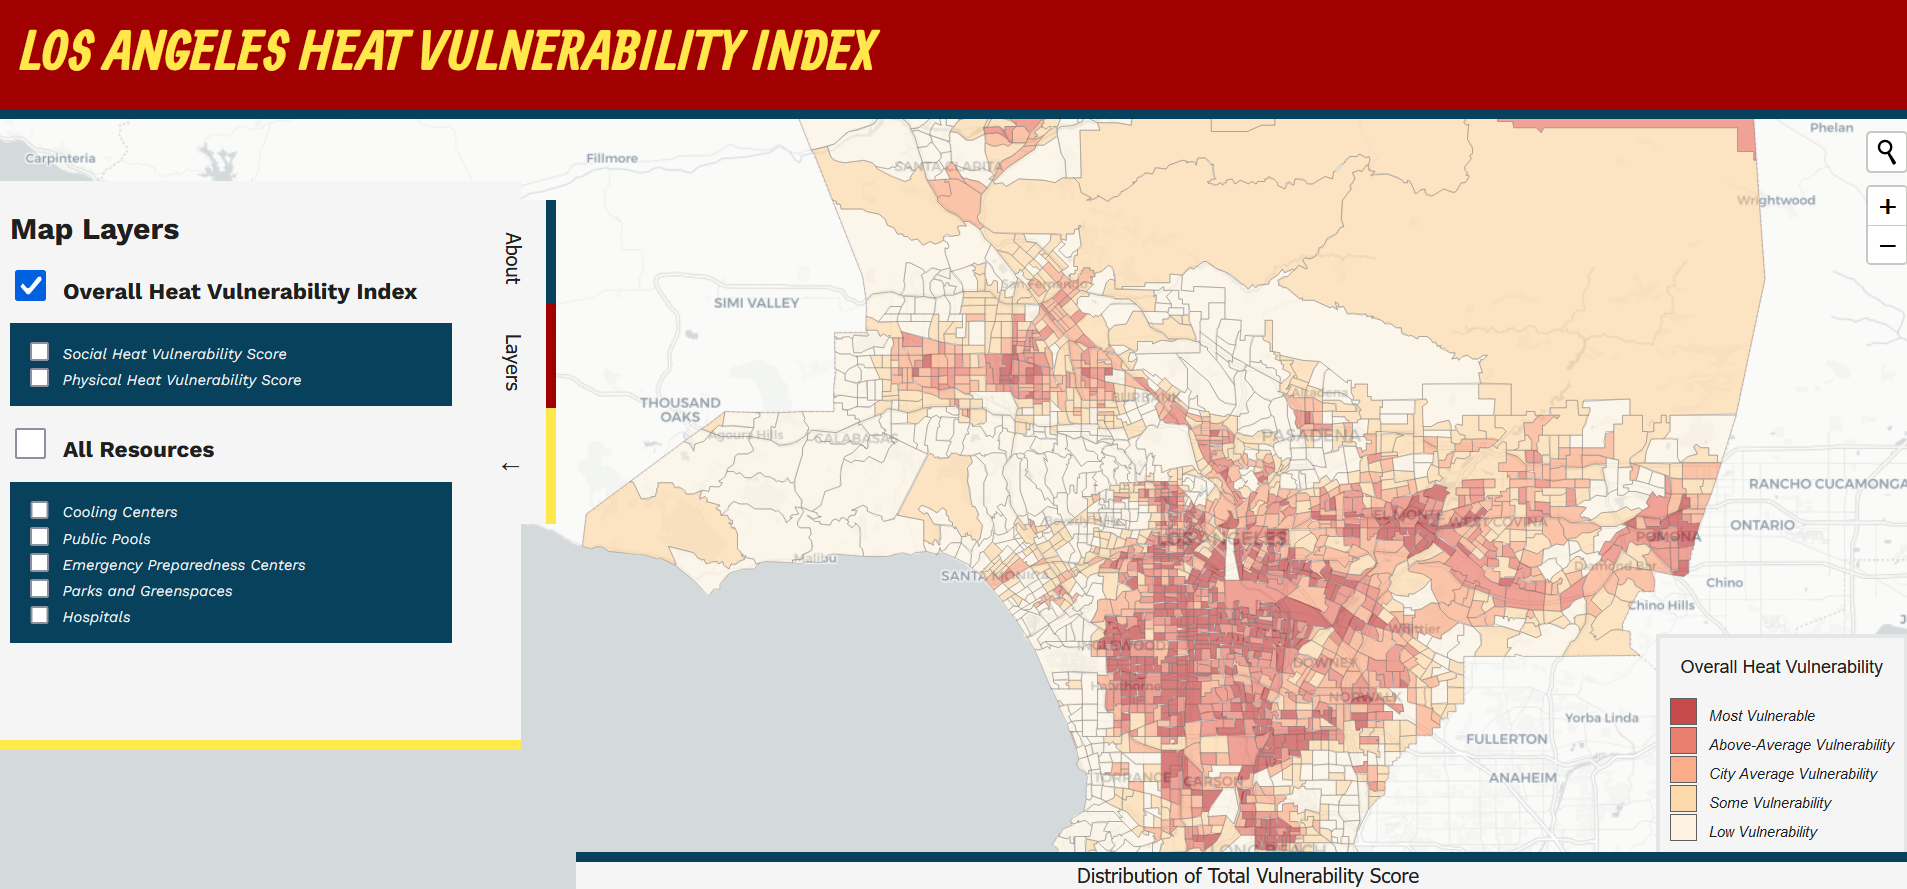
dashboard

Los Angeles Heat Vulnerability Index Dashboard

Read More

Taking inspiration from the City of Philadelphia's "Philadelphia Heat Vulnerability Index" map, this dashboard highlights the populations and areas within Los Angeles that are most vulnerable to extreme heat events. This dashboard was built to first inform policy makers and city program coordinators of this multi-faceted issue and to provide them with a tool to use to better allocate and build climate adaptive resources and strategies. Secondarily, L.A. residents can use this tool to identify important local community resources that exist to help them cope with or mitigate the effects of extreme heat.

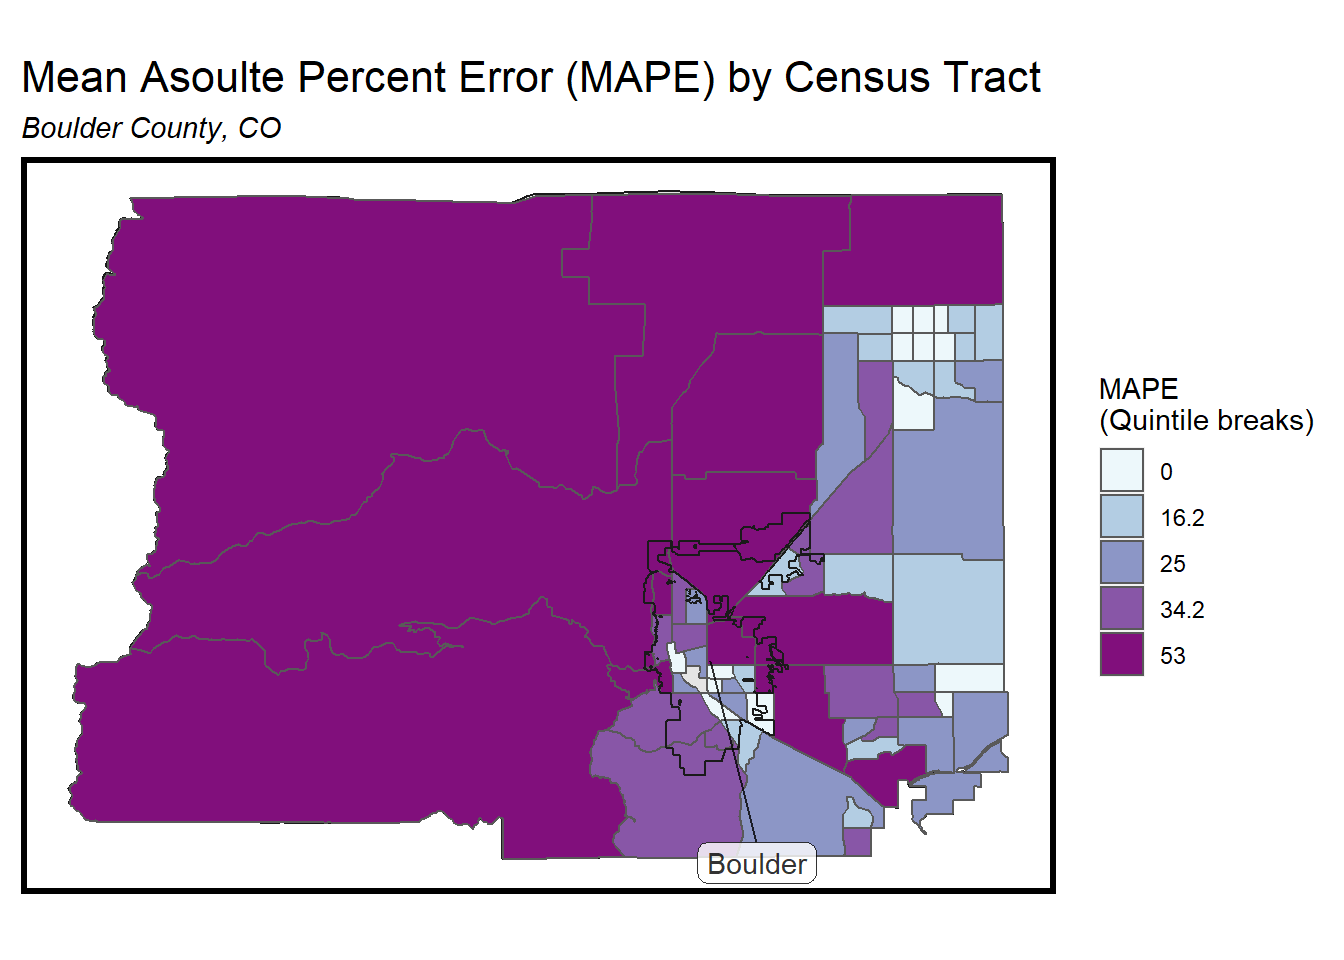
mape

Predicting House Prices in Boulder County, CO.

Read More

In the fifteen years since its founding in 2006, Zillow has become synonymous with high-quality home price predictions. Following the national reckoning with the myriad of ways racism is embedded into American culture during the summer of 2020, many people within Zillow began questioning our product's reliance on data collected by police departments. To this end, our research team (Briana Cervantes and Cypress Marrs) has spent the last few weeks exploring alternative indicators that might be used to replace crime data. We developed these metrics within Boulder County, CO. Although the model we developed lacks the predictive power of Zillow's current model, we hope that our work on alternative indicators may become a leader again, this time in prioritizing the public good within algorithm design.

Constrained by using a simple, but explainable linear regression model, we used this project to flex our feature engingeering skills.

story map dashboard

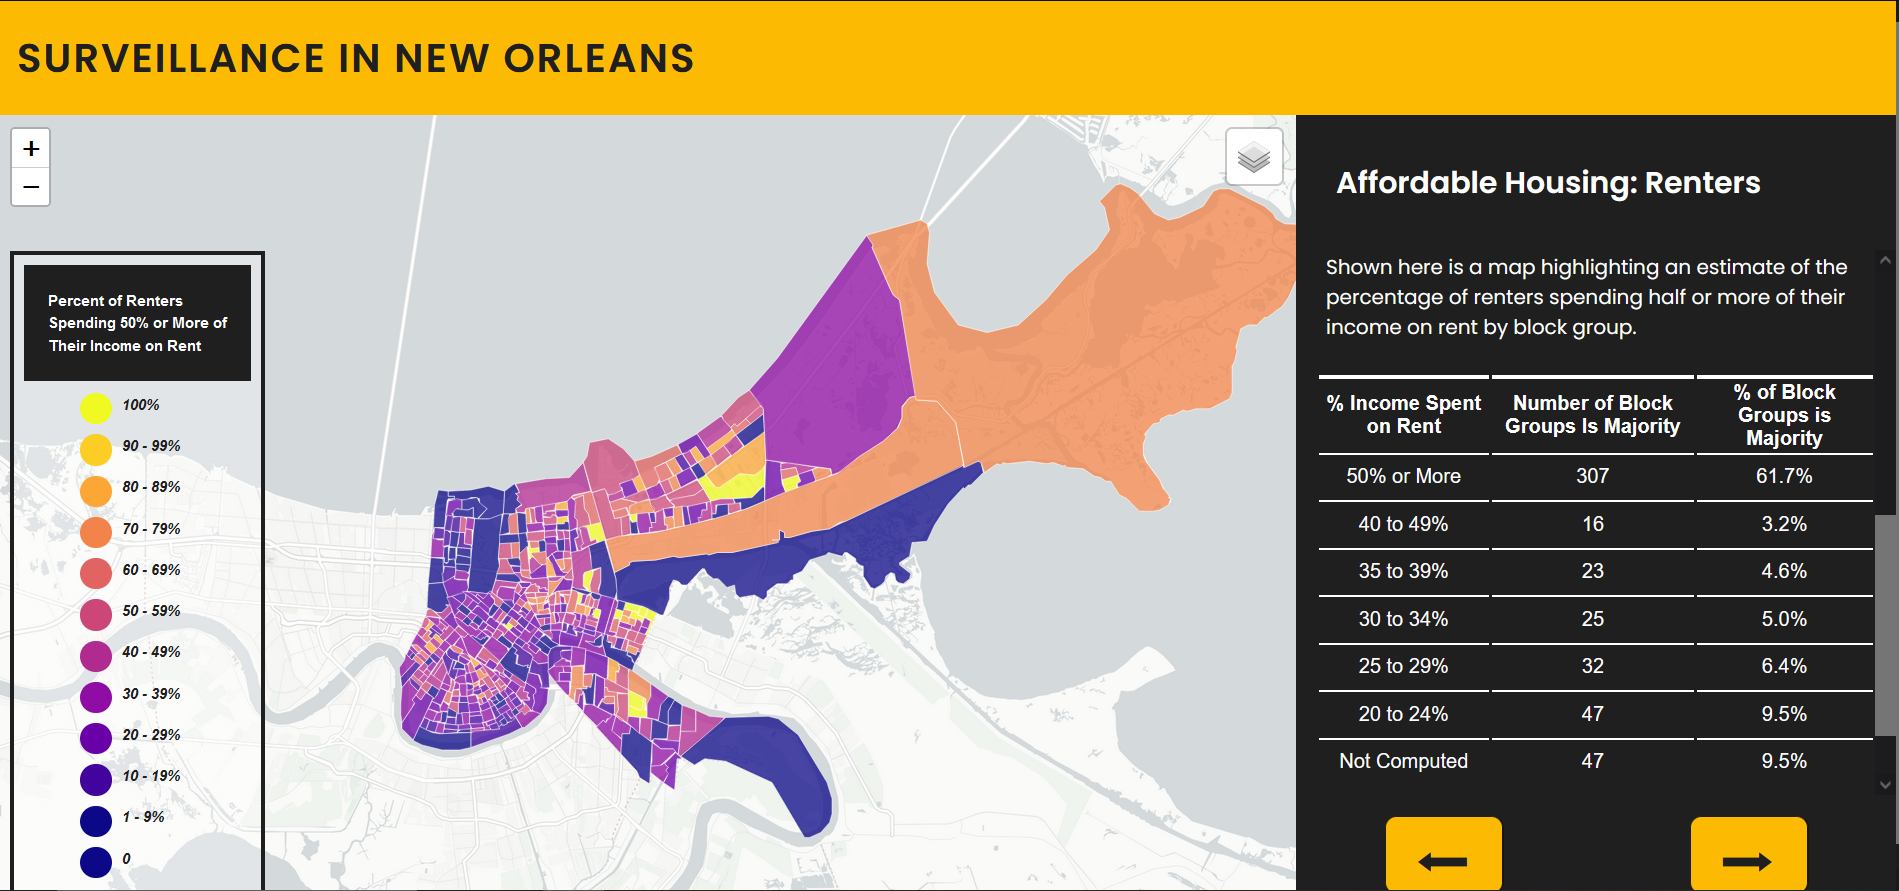
Survelliance Policy in New Orleans in 2020

Read More

This project is an adaptation of a yearlong report published by The Lens, a non-profit non-partisan new source in New Orleans. The additional maps that incorporate census data and the location of community assets consists of preliminary and mostly exploratory research. If you see something incorrect or that you consider as misinterpreted, please reach out to cervantes.blc@gmail.com.

Any and all feedback is welcome!

graph

Predicting Customer Churn in a Public Policy Context

Read More

The Department of Housing and Community Development in Emil City* has no doubt that their home repair tax credit program is does good and is of social benefit. But they are not certain that their tactics to recruit eligible homeowners will yield succesful results. This report explores the usefulness of employing an algorithm to proactively identify eligible homeowners that are more likely to accept a home repair tax credit. In doing so, the Department of Housing and Community Development (HCD) of Emil City will know were to direct their limited marketing resources for the most gain.

*Emil City is a fictional city.

logo of redditor mining upvotes

"Am I talking to a poorly designed bot or a way below average person?"

Read More

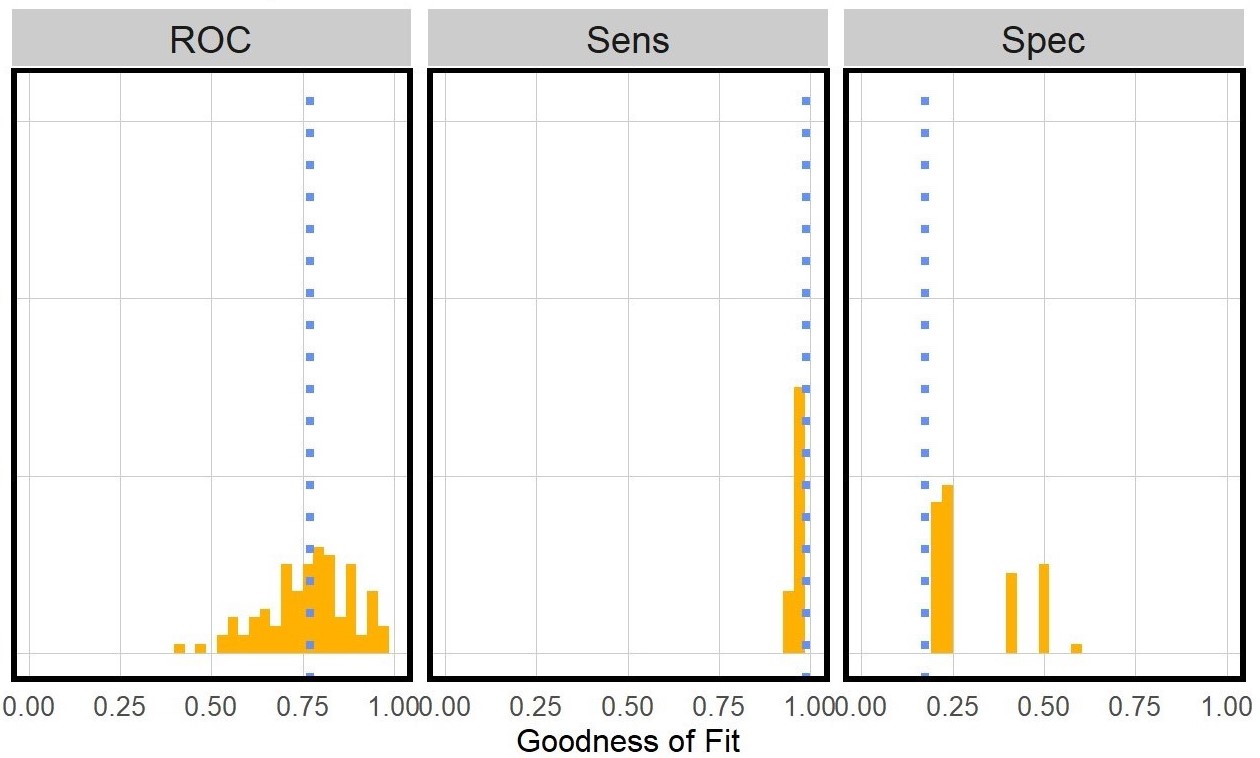
In 2020, the rise of r/WallStreetsBets (WSB) exposed the nation to the reality-creating power of Reddit. We all watched, or maybe even participated, as the subculture of WSB spilled out over the stock market, turning internet ideas into IRL impacts. But given that Reddit is open to anyone and tends to promote user anonymity, anyone can harness the platform's culture-shifting power with the right resources. Working alongside with my fellow researcher Gianluca Mangiapane, we sought to develop a way to identify robot users in the comments. To do so, we constructed a logistic model using sciKitlearn in python. Adapting work done by Eamon Flemming predicting gender from reddit comments, we developed a tool to predict robots in the comments of reddit posts.

series of graphs

eNJine: Engineering a Better Commute.

Read More

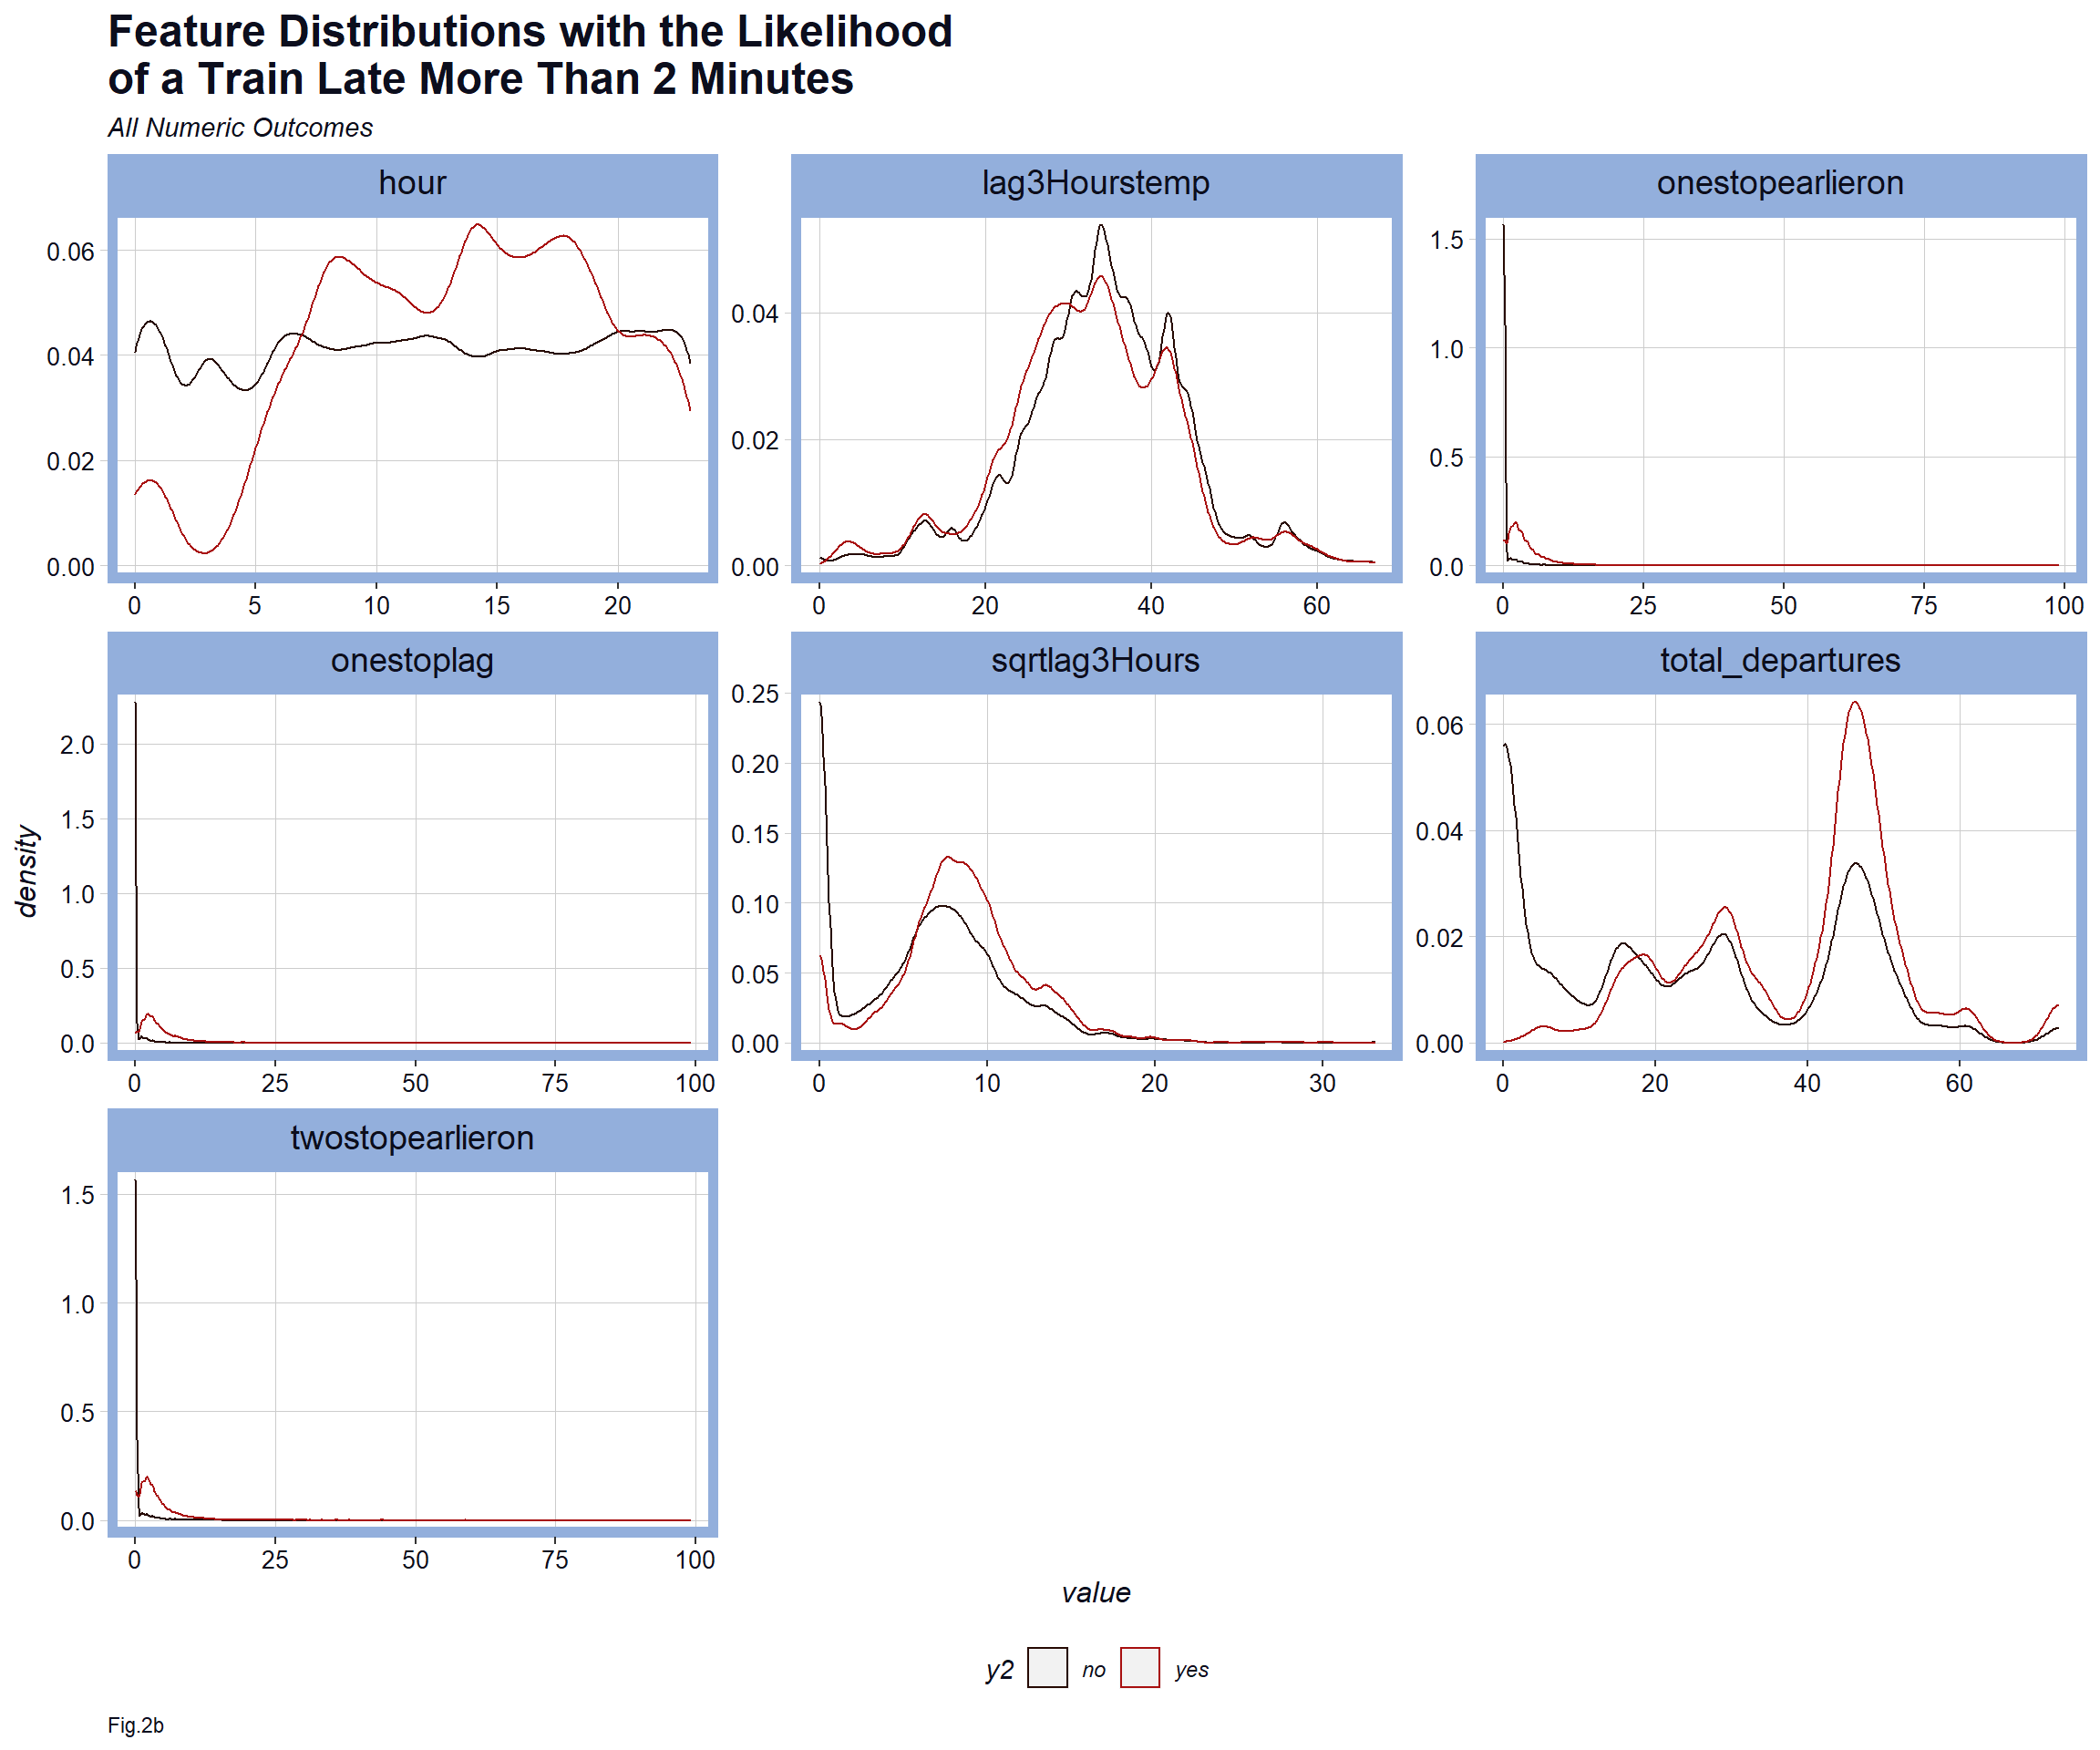
Using recently released transit data from the New Jersey Transit, myself and my colleague, Cypress Marrs, built a proof of concept product to predict train lateness. This project was done in R.

If you have ever felt like NJ Transit needed work, you are not wrong. In January 2019, stations across the New Jersey transit system experienced the equivalent of about 1 year 8 months worth of delays. But what if you could know your train was running late before it was running late? At eNJine, we are making this possible.

Icons courtesy of the Noun Project:
  • Resume by Design Circle
  • Linkedin by azapron